
How Sentinel works
Sentinel combines on-site sensors and cloud-based analytics to give stakeholders immediate, reliable insight into how their structure is performing during and after an earthquake.

It all starts with the sensors
Sentinel begins with strategically placed seismic sensors installed within your building or asset. These sensors are positioned to capture meaningful data about how the building actually behaves, not just what is happening at the ground surface. Every Sentinel sensor is constantly recording high-fidelity acceleration measurements in both horizontal and vertical axes at 200 samples per second. This continuous signal is processed to detect earthquakes and communicate this to our Sentinel servers.
Earthquake detection and data capture
When Sentinel detects an earthquake, it waits for the shaking to finish and then retrieves the acceleration data from the sensors within your building. It then performs a Fourier Transform on the raw acceleration data to convert it to the frequency domain. The resultant data product is called the ground response spectrum.

Raw acceleration data from the sensors within your building.
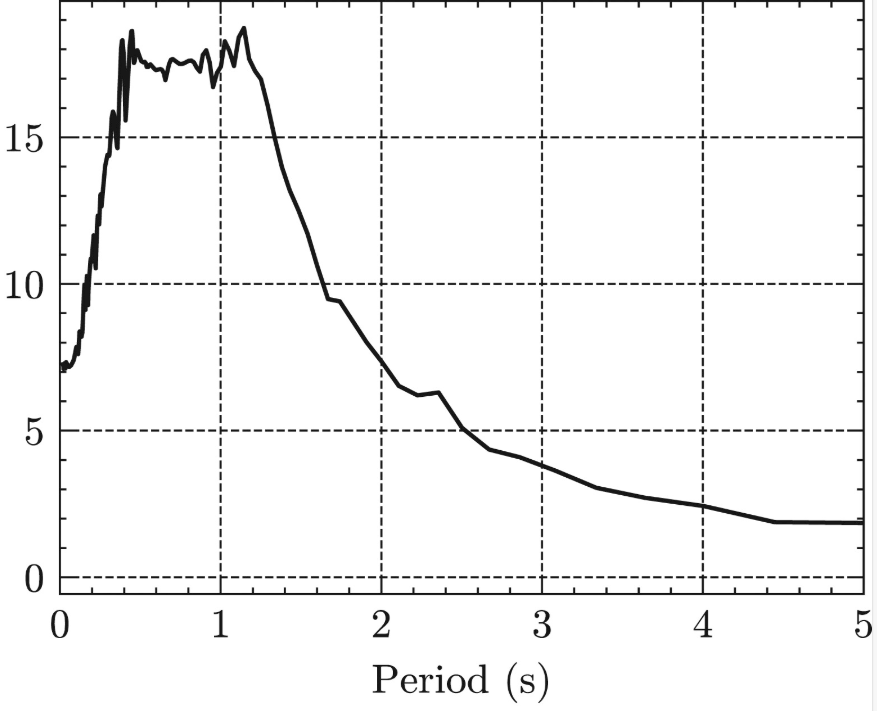
Ground response spectrum for your building.

Direct comparison
In the NZS 1170.5 New Zealand Building Code, the seismic requirements of a building are defined in terms of ground response spectra. This means Sentinel can directly compare the measured ground shaking at the building's location to the seismic design of the building.
The NZ Building Code defines two separate “limit state curves”:
Ultimate Limit State (ULS): This curve defines the threshold at which structural damage might be expected.
Service Limit State (SLS): This curve defines the threshold where non-structural damage might be expected (lights, ceiling tiles, windows, pipes, etc).

The Ultimate Limit State (top) and the Service Limit State (bottom) for an example building with the horizontal (blue) and vertical (red) demands shown.
These curves vary widely for different buildings depending on several factors, such as the importance of the building, the type of soil the building is built on, the regional risk profile, and the distance to the nearest fault line.
Sentinel takes all this information into account to generate the correct limits for your building.
Sentinel makes it easy
Sentinel translates this engineering information into a simple, traffic light system based on the above NZS1170.5 curves. Sentinel sets the Red state threshold at the ULS curve and an Amber state threshold at the SLS curve.

WHITE
The ground response spectrum was within the SLS and ULS limit curves.
Action: Business as Usual

AMBER
The ground response spectrum exceeded the SLS curve but was within the ULS limit curve.
Action: Inspect for hazards

RED
The ground response spectrum exceeded the ULS limit curve.
Action: Evacuate immediately
Enabling faster, safer decisions
Within minutes of the earthquake completing, Sentinel sends alerts via SMS, email and the Sentinel Mobile app to stakeholders containing their building's status and a recommendation for the response procedure.
No more guesswork - Make informed decisions with confidence.

Want to know more?
Our team are happy to answer any other questions you may have. Get in touch via the link below and we'll get right back to you.